How to run financial reports for a month, quarter or any period
Last updated 4 November 2026
Run a Profit and Loss or Balance Sheet for a month, a quarter, a half year or any range, compared with the period before. How custom periods work in Report Craft.
Year-end statements are only part of the job. A client wants to see how the December quarter went, a bank wants the half year, and you want to look at last month without exporting anything. Custom periods let you run a report for any run of whole months, from the same screen and in the same format.
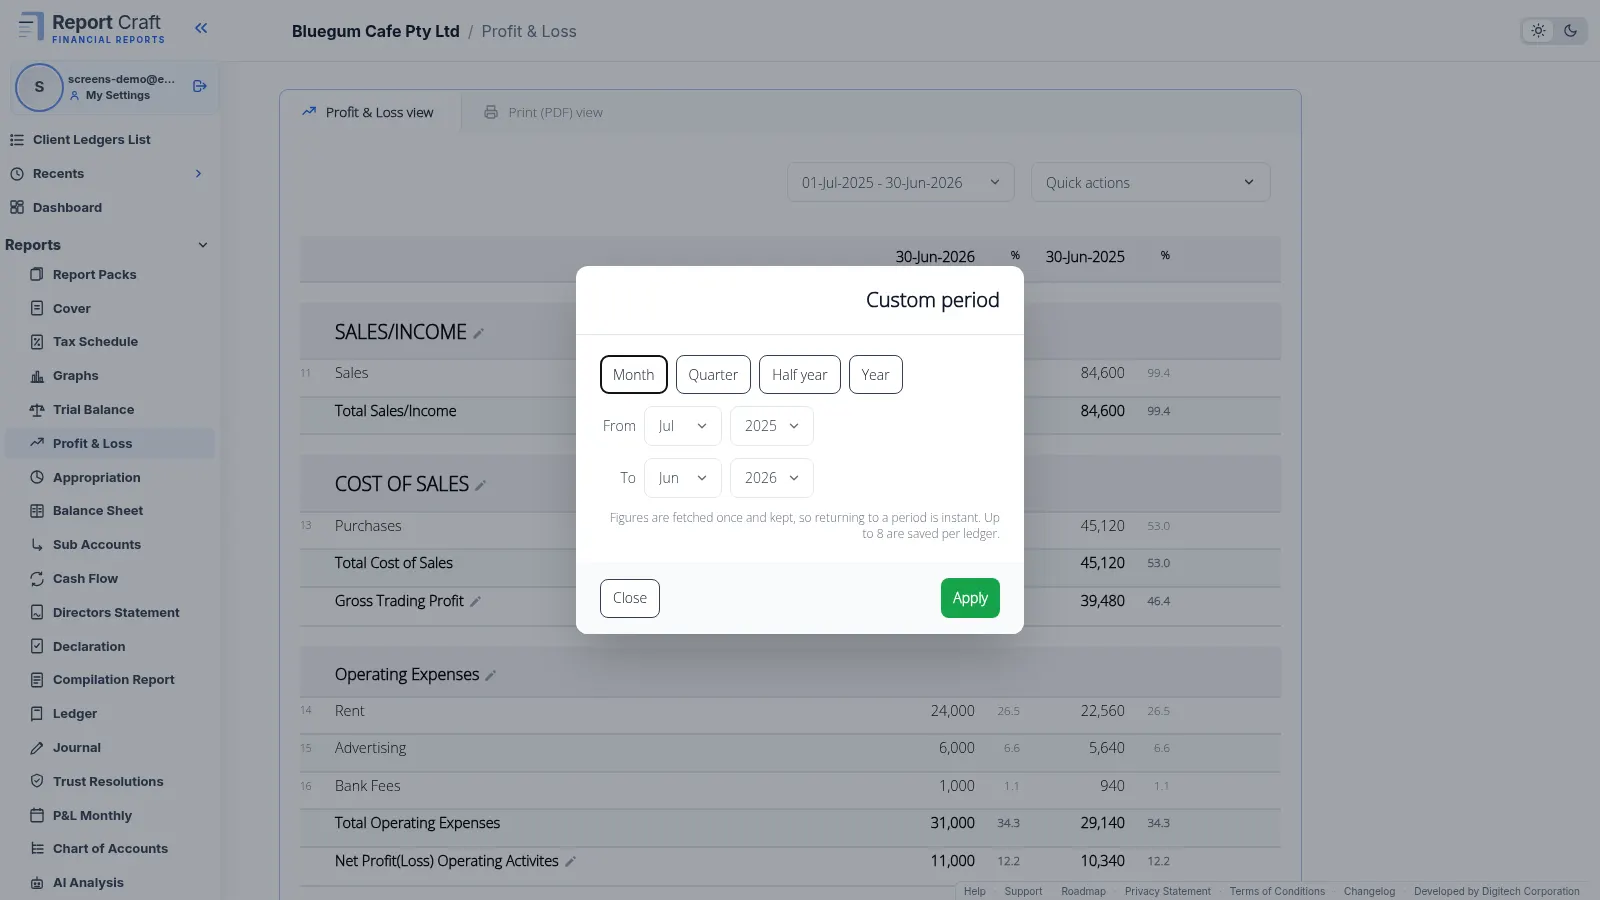
Running a custom period
- Open a report and click the period dropdown at the top.
- Choose Custom period.
- Pick From, then Month, Quarter, Half year or Year to count forward from it, or set From and To yourself.
- Click Apply. Report Craft fetches the figures and shows the report.
Compared with the period before
A custom period is compared with the period straight before it, of the same length, not with last year. Run October to December and the comparative is July to September, which is the question you are usually asking of a part-year: is it getting better or worse?
Quicker the second time
- Saved periods reappear in the dropdown, up to eight per ledger, so a period you run each quarter is one click away.
- Figures are fetched once, so going back to a period is instant.
- The last 12 complete months are fetched in the background after a refresh of a QuickBooks, Xero or MYOB ledger, ready to pick.
Good to know
Custom periods work on QuickBooks, Xero, MYOB and imported ledgers. The Dashboard and graphs stay annual, because they compare financial years. On a connected ledger, a custom period shows the package's own figures without your Report Craft adjustments, and the report says so.
See it in the custom periods how-to video.
Try it on your own clients
Connect a QuickBooks, Xero or MYOB ledger, or import a spreadsheet, and have a full report pack in minutes. Free for 14 days.
Related guides
How to add your own pages to a client report pack
Add your own pages to a pack - charts, text boxes and pictures, dragged where you want them - and stamp it Draft or Confidential.
How to create financial statements from a spreadsheet of balances
No accounting package? Create a ledger from up to five years of balances, using our downloadable template, and every report is ready.
How to track custom financial ratios for a client
Measure wages against sales, or anything against anything, and draw it as a pie chart on the Dashboard or in a report pack.
A financial dashboard for every client ledger
Every ledger opens on its headline figures against last year, with charts you add, change and drag into place.
Professional financial reports from MYOB, for accounting firms
Connect MYOB company files alongside QuickBooks and Xero, with figures that match MYOB to the cent and refresh overnight.