A financial dashboard for every client ledger
Last updated 4 November 2026
See a client's headline figures against last year and five years of charts as soon as you open the ledger. How the Report Craft Dashboard works, and how to make it your own.
Before you read a client's statements, you want to know what you are about to read. Is revenue up? Did the margin hold? Is working capital getting tighter? In Report Craft, every ledger opens on a Dashboard that answers those questions before you have opened a single report.
What's on it
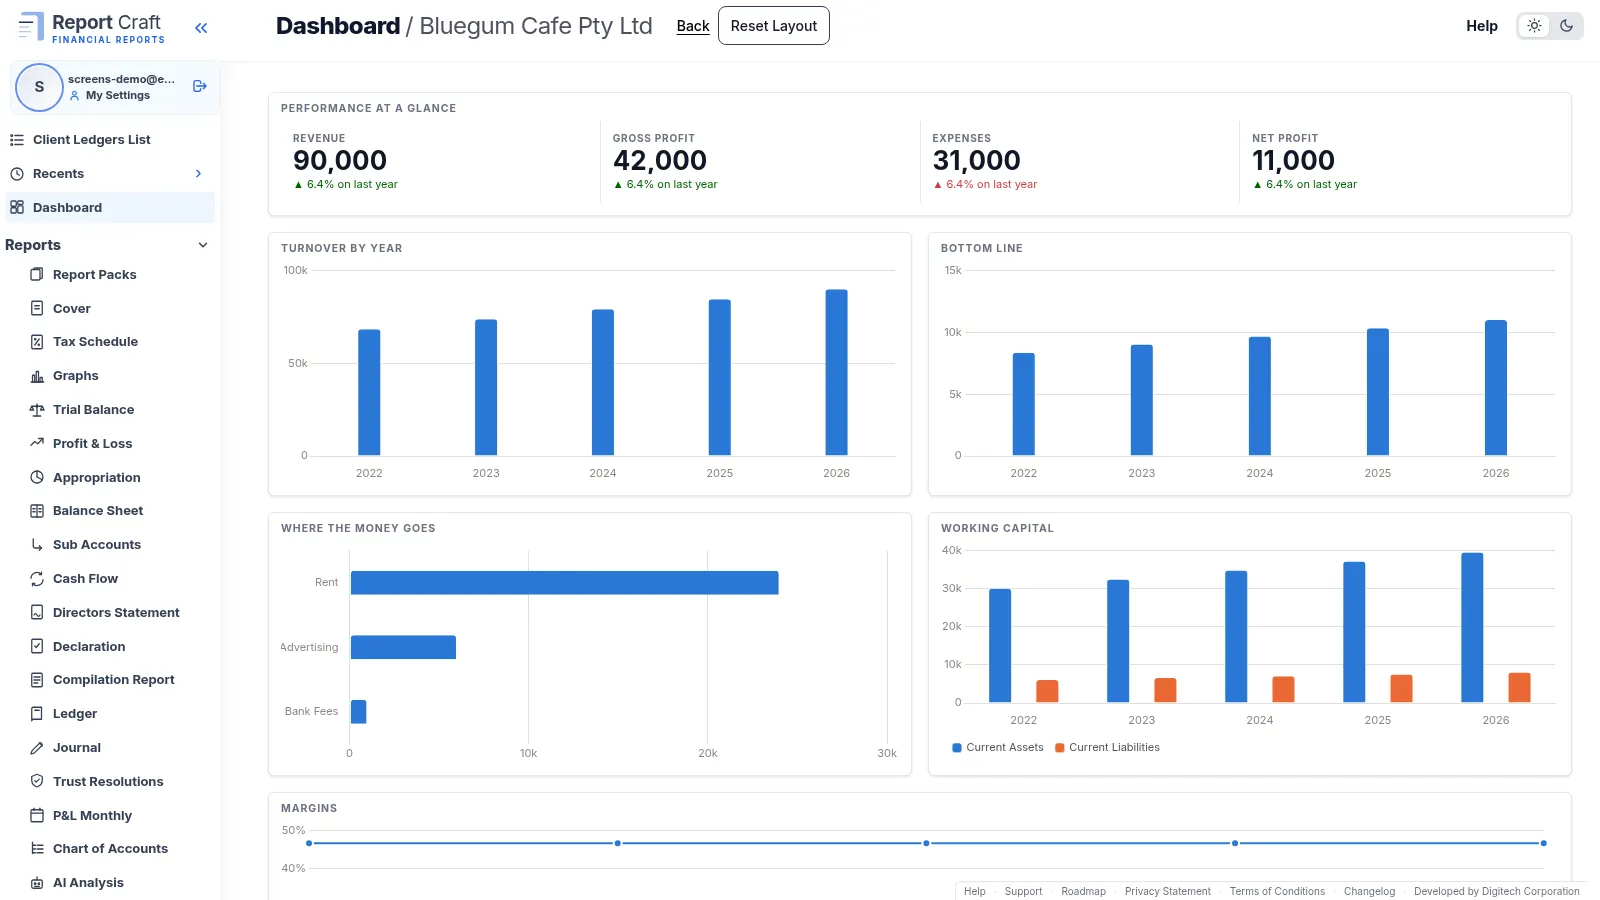
Across the top, the headline figures: Revenue, Gross Profit, Expenses and Net Profit, each against last year. Below them, charts drawn from five financial years: Performance at a Glance, Turnover by Year, Bottom Line, Where the Money Goes, Working Capital and Margins.
Make it fit the client
- Drag and resize any box. The layout saves as you go.
- Click Add Widget to choose another chart, such as Turnover against Costs, Gross Profit by Year or Current Assets to Current Liabilities.
- Use the cog on a box to change its chart, or the cross to remove it.
- Add a Custom Ratio from the same list, drawn as a pie.
- Click Reset Layout at any time to put everything back as it started.
The layout belongs to the ledger, so everyone at your firm sees the same view of that client.
Use it in the client meeting
A Dashboard is the quickest way to open a review. Start with the headline figures, follow a chart down into the report behind it, and click any account to open its ledger. Clients see one too: their portal has a Dashboard tab beside their finalised statements. And any of the charts can go on a page of your own in a report pack.
Watch the Dashboard how-to video, or learn to build a Custom Ratio to add to it.
Try it on your own clients
Connect a QuickBooks, Xero or MYOB ledger, or import a spreadsheet, and have a full report pack in minutes. Free for 14 days.
Related guides
How to add your own pages to a client report pack
Add your own pages to a pack - charts, text boxes and pictures, dragged where you want them - and stamp it Draft or Confidential.
How to create financial statements from a spreadsheet of balances
No accounting package? Create a ledger from up to five years of balances, using our downloadable template, and every report is ready.
How to track custom financial ratios for a client
Measure wages against sales, or anything against anything, and draw it as a pie chart on the Dashboard or in a report pack.
How to run financial reports for a month, quarter or any period
Run reports for a month, a quarter, a half year or any range, compared with the period before and saved for next time.
Professional financial reports from MYOB, for accounting firms
Connect MYOB company files alongside QuickBooks and Xero, with figures that match MYOB to the cent and refresh overnight.